Weekly Update
Email This Article To A Friend
Is the Coronavirus Bear Market Over?
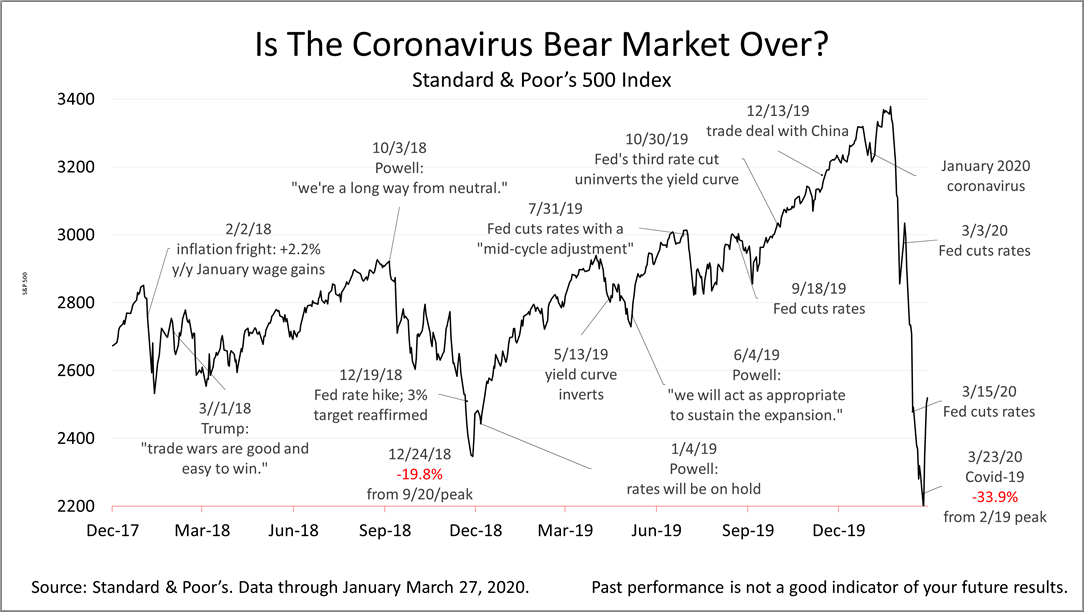
(March 27, 2020, 8:30 p.m. EST) After nosediving 33.9% between February 19 and this past Monday, March 23, the Standard & Poor's 500 stock index rebounded sharply and ended the week about 13% off its bear market low.
While the vicious plunge may resume, signs that the worst of the coronavirus bear market may be over began to emerge.
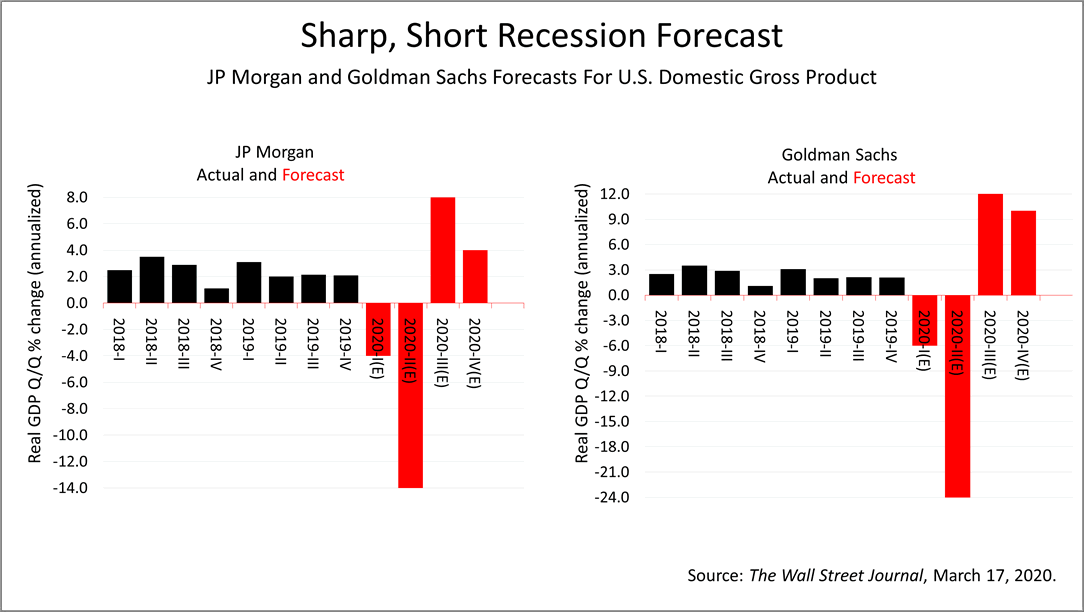
JP Morgan and Goldman Sachs both forecast an unprecedented contraction in the second quarter ending June 30, 2020, followed by a third quarter surge in growth. Goldman Sachs expects a mind-bending 24% contraction in the second quarter while J.P. Morgan forecasts a 14% slowdown in Gross Domestic Product.
But the third quarter of 2020 forecast by J.P. Morgan for an 8% quarterly growth rate and 4% in the final quarter of 2020, and the forecast from Goldman is about 50% higher in the same quarterly periods.
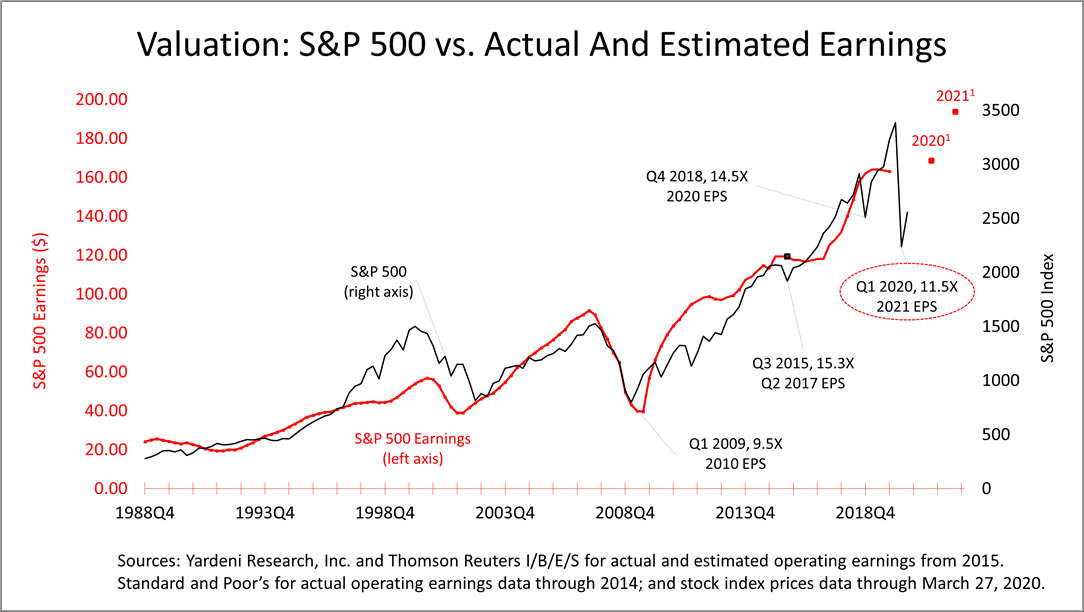
Another sign is the recent low in the valuation of estimated earnings of America's largest 500 publicly traded companies.
At the bottom of the coronavirus bear market on March 23, the average share in a company in the S&P 500 sold for $11.50 for every $1 of earnings expected in 2021 a price-to-earnings multiple much lower than the long-term historic norm.
At the low point of the 2008 global financial crisis, the worst financial crisis in modern history, the average S&P 500 company traded as low as $9.50 for every $1 of earnings expected. We're not as low, but that crisis didn't have a bottom that could be quantified, while this one does. A March 20, 2020, New York Times report estimated this wave of the virus crisis would peak in the third week of June. A steep decline in July, The Times expert projected, would bring an end to the epidemic in August, and then the economy would be close to normal again.
The fact that the spread and decline of the virus is fairly predictable makes this crisis as terrible as it is -- less severe than the 2008 global financial collapse.
The solid red line indicates actual S&P 500 operating earnings per share of $163.00 in 2019. The red dots are 2020 and 2021 estimates of earnings per share, as of March 23, 2020, for $168.61 per share in 2020 and $193.72 in 2021.

The S&P 500 is priced low relative to its historic valuation level, based on earnings expectations as of March 23. Stocks are cheap, by historic standards.
Although history is not a predictor of future results, the rebound from the low of March 23 left the S&P 500 below its price-to-earnings multiple of 16, which is the low end of its norm. Just six weeks ago, the black line was well above the high-end of the valuation band, which is the upper band in red.
The solid red line indicates actual S&P 500 operating earnings per share of $163.00 in 2019. The red dotted line is 2020 and 2021 estimates of earnings per share, as of March 23, 2020, for $168.61 per share in 2020 and $193.72 in 2021.
If you believe stock prices, the black line, follow earnings, the trajectory for stocks, based on 2021 earnings estimates, is a steep upward line.
The Standard & Poor's 500 index, a benchmark of the value of America's largest 500 publicly traded companies, free markets, and a proxy for world progress, closed Friday at 2541.47.
The Standard & Poor's 500 (S&P 500) is an unmanaged group of securities considered to be representative of the stock market in general. It is a market-value weighted index with each stock's weight proportionate to its market value. Index returns do not include fees or expenses. Investing involves risk, including the loss of principal, and past performance is no guarantee of future results. The investment return and principal value of an investment will fluctuate so that an investor's shares, when redeemed, may be worth more or less than their original cost. Current performance may be lower or higher than the performance quoted.
Nothing contained herein is to be considered a solicitation, research material, an investment recommendation, or advice of any kind, and it is subject to change without notice. It does not take into account your investment objectives, financial situation, or particular needs. Product suitability must be independently determined for each individual investor.
This material represents an assessment of the market and economic environment at a specific point in time and is not intended to be a forecast of future events or a guarantee of future results. Forward-looking statements are subject to certain risks and uncertainties. Actual results, performance, or achievements may differ materially from those expressed or implied. Information is based on data gathered from what we believe are reliable sources. It is not guaranteed as to accuracy, does not purport to be complete, and is not intended to be used as a primary basis for investment decisions.